Monday, May 4, 2009

Gold Silver and Treasury Bonds

Is it time to buy Precious Metals and Short the broader Markets in near term ?

Here's ratio chart of the gold price versus the S&P 500 Index not weighted index just representing the top 500 companies on the index. Most equity markets worldwide also fall or rise roughly in line with the S&P 500 index. The higher the ratio, the more gold is worth compared to the equity market. The ratio appears to be in a very strong, long-term bull market.


The most anticipated correction in the ratio of gold to s&p 500 back to 1.00 has taken its position before moving higher.This signal is tells us either we are close to buy on gold or exit the broader markets and there is even a more correction back to 0.8 levels possible case to support the bull case for future run. So target on
S&p: 930-945 mostly likely possible with gold between $855-$823


Is Gold moving in parabolic path for the rest of the year ?

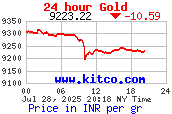
Gold is consolidating at these levels and its almost in final phase before moving up.A little push over $920 would drive to $1000 again and breaking those levels will be a clear sign its heading for all time highs in coming weeks and months and my initial target would be around $1200/ounce.


Will Silver outperform Gold ?

Yea I believe we might see a strong % gain in near term when compared to gold to silver ratio.Gold has be a precious metal all these years but where as silver been used for industrial use this never got that recognition as precious metal when compared to gold palladium platinum etc.My target on this one would be $50 before we end this in another 24 months or so.


Finally, treasuries might be bursting the bubble after having to accept as safe haven after market crash or is testing the support for the next bear market.Falling below 112 will give more clues after US long term economy outcome.


Banking Index and JP Morgan Chase

Markets are waiting for the stress test on banks which are due on Thursday i.e May 5th. According to the one of the leaked report from tuner radio network (http://turnerradionetwork.blogspot.com/2009/04/leaked-bank-stress-test-reults.html), which shows that technically 3 are solvent out 19 what does that suggests us more down side in the recent rally in the financial as they are leaders for the broader markets.But what does the banking index gives us the clues as we are technically at the resistance level and due for correction for another consolidation or further down the toilets. Definitely banks are caught with the swine flu and Dr. Barnanke had to quarantine before they can function properly. Its wait and watch game going on for the last couple of weeks and they don't know how to release this mess.


Another major down side move would be in banks and on housing cycles when the ARM's reset which are due this summer would fail around 8 millions homes according to the credit suisse. Here's is the chart which not only shows that subprime is small part when compared to option ARM's.

Click for larger pic.


Source: Credit Suisse.


Watching closely JPM which is one of the respected banks on wall street with least exposure to sub prime but does have 2nd order derviates on thier sheets which will bring down this giant bank, but at wat levels ? I feel that breaking below the 2009 lows will definitely have the domino effect on the banking index as well as the entire markets. So watch closely JPm, If this crashes then entire markets are due for crash.


PBS: Breaking The Bank