Thursday, July 16, 2009

Market And Gold Updates


Markets to me looks like we are headed for a blow off tops (meaning markets moving higher for brief period ) suggesting significant drop in market value in every asset value. So please don't chase this market. Price to volume action does not a suggest strength in markets but like a house of cards the image below will give u a total pic how this markets are gauged, And it may fall apart at any moment. Markets are manipulative at this juncture for sure and volatility index is getting compressed to escape from the trending range.


Dow Jones Industrial Average

click image for sharper view

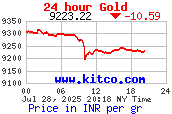
Gold Chart

Click image for sharper view

Weekly Natural Gas Storage Report


Click for Sharper Image and Full Report Here

Working gas in storage was 2,886 Bcf as of Friday, July 10, 2009, according to EIA estimates. This represents a net increase of 90 Bcf from the previous week. Stocks were 589 Bcf higher than last year at this time and 454 Bcf above the 5-year average of 2,432 Bcf. In the East Region, stocks were 116 Bcf above the 5-year average following net injections of 62 Bcf. Stocks in the Producing Region were 246 Bcf above the 5-year average of 786 Bcf after a net injection of 19 Bcf. Stocks in the West Region were 91 Bcf above the 5-year average after a net addition of 9 Bcf. At 2,886 Bcf, total working gas is above the 5-year historical range.

Janet Tavakoli On Recent Financial DownTurn

PBS: Breaking The Bank