Wednesday, August 29, 2012

SILVER DE TOUR......


Silver along with gold has been bullish lately, And broke the medium term down turn on current price action drawn in blue circle.Silver is an inflationary hedge, And has been testing the longer term trend channel going back to 2008 when lehman brother bankrupted, And JP Morgan took Bear Sterns short position to make things look like bleak in white metal.

Anyway we were about to a test back to the downsloping channel on this around $28 area, And after that this would challenge all time high either Q4 2012 or Q1 2013 Once it gets pass all time highs then it will flex it muscle which can blow everyone out of thier seats.......thats the kinda of silver price action will be.My target in silver will be $70/0z before end of 2013 which is drawn in red circle Here's the longer term picture of silver.

Monday, August 13, 2012

Currency Market Updates

USD INR currency Pair

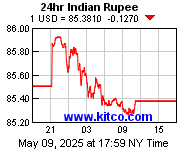
Indian Rupee has shown weakness during this entire year (previous post) which was quite normal bcoz of the RBI buying gold instead of the dollar swaps for the trade deficits (i.e exports,imports) in 2009.Here, we have the data for the USDINR pairs which  hit the initial upper price band around 57, And trying to consolidate in near future but this consolidation is showing some strength in the rupee which is good for import, And this is building a lower channel trend here which has immediate resistance around 56, And the downside would be around 52 which will be due sometime in Q4 of this year.Once this consolidation is finished this will gain the momentum to target to all time high again, And if that's breached then we will have target of 66, then over new normal on Indian rupee will be around 55.


 EUR USD Currency Pair-

This pair is showing more weakness when considereded to USD, And that in turn does not suggests that USD is strong.All the traders are trying to do is jumping from EUR to USD boat, And thats a safe heaven play but once the USD chicken come to roost then it will sink like a titanic which will not only effect the US but bring all the rest of FIAT CURRENCIES along with it.

EUR is the main concern here, the deep pocket players are trying to short this pig as there is no tomorrow for the EURO Zone as the Open Interest is rising pretty quickly.EUR is going to decide the equities markets as euro implodes so does the rest of the globex equities goes as dollar strengthens but this will be a  temporary deflationary forces on the credit markets but when you look closely in the real natural resources where there is shortage of supply side economies which will eventually explode to higher side espl on soft and hard commodities.Take a look at this chart
 

Friday, August 10, 2012

State Bank Of India

There was alot talk about the SBI results today but there is noway there will be bullish on this stock.Okay let take a look at the chart in longer term.State bank is in bearing trend right from may 2011when it pierced my moving average cloud, And after that you will notice it kisses the underneath the cloud which is bearish going forward.

Next support for SBI is 1800-1600 area
Immediate Resistance 2150-2200

Good Luck
Happy Trading


Nifty F&O Swing Trading Idea


Thursday, August 9, 2012

New Home Address

My New Home address with all the contact(s) are embedded with in the photo.
Guyz if you are within the city let me know.


New Life Time High(s)

Russel 2000 Life Time High

After little data mining for the past 20-25 years chart i could able to find out few stocks that are targeting new life time high but once it breaks past that we will have the explosive moves that will target for the entire move.


 These are the stocks for the longer term where the price can explode even the severe market correction as well.


Good Luck
Happy Trading.

Precious Metal Updates :Gold And Silver


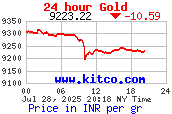
Precious metals are showing some signs of life back after having  consolidation in dollar term right after the may day fall, And this is been orchastered by the bullion banks and central bank cartel.These markets are capped so that big hedgies does not enter into the tiny bullion markets but when you look at the price action lately this is been spring coiled and ready to rebound in 2013.

Short Term Chart:

Short term pic suggest that the gold market is in symmetric triangle for the past few weeks and it broke to the upper side of the triangle and it is successfully testing the triangle again but remember the apex is time anlaysis to the enter move, And it may test based on the fed move again.Once it takes $1640-$1660 level it can easily cruise towards to $1700 levels from there it can again target the all time highs.

Note: Normally I don't like posting the short range picture as it will have huge impact on longer term


Gold Longer Term Chart

Gold longer term chart shows the open interest to price does not shows a immediate rise in the price action but will eventually gain the momentum in this once the market gets imploded in sept-nov so the fed action will pump this markets with new easing of money, And we will the price discovery in gold taking off the new highs in coming weeks and months.Now lets have look at the chart, gold is making a rounding bottom formation which is more bullish the more the consolidation the greater the force it will have .


Silver longer term Chart:

This looks quite similar to that of the gold but these markets are more manipulative then any other markets after data mining.But once the economy implodes then this will take 1:16 ratio of the gold as this is industrial as well as the monetary metal.This will rocket into stratosphere.Anyway time will tell as we enter into those double digit inflationary environment


There are few stories lately on the precious metals line:

Central Banks are controlling not to enter money in these sectors.

 When the markets capped then central banks around the world are slowly  accumulating in their portfolio.China holding large treasury bonds and now they are going for gold holding.


PBS: Breaking The Bank