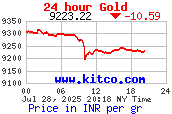
So whats my year end target for the gold is $1600-$1800 and silver might kiss the 1980's high which is $50.Below are different time frame charts for the gold and silver.
Gold Longer Term Chart

Medium Term Chart
Gold shorter term making cup and handle formation or Inverted H&S formation which is bullish which will drive this formation to $1520 and consolidation will drive all the way to my year end predictions.

Silver Longer Term Chart
Silver chart as always shown more strength then the big brother gold.This is definitely will blow every once mind when it reaches to levels of gold.May be this financial cry might bring 1:1 before it peaks but year end will be $50.Good luck folks on this as this will create a wealth to once portfolio.

Gold to Silver Ratio
Gold to silver ratio telling us that little brother silver took the lead in the current financial crisis game plan.Historically during 1980's gold to silver ratio ran till 17 (850/50). So we might see the ratio going to those levels or even lower based on the supply demand ratio driver along with big bullion banks short positions but the current ratio has definitely broke the longer term ratio with the decending triangle in execution in place.Gold/Silver is true money gauge. So selling paper money with true money is nothing but gold/silver.


No comments:
Post a Comment